
Best Technical Indicators for Crypto
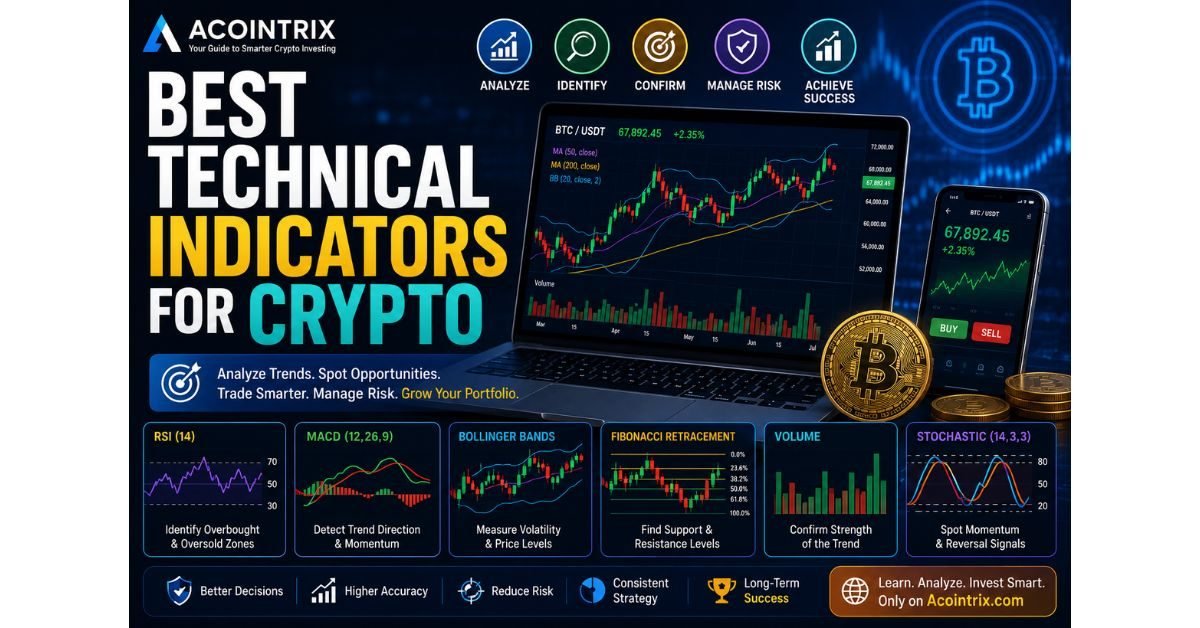
Best Technical Indicators for Crypto help traders analyze price movements, identify trends, measure momentum, and improve decision-making. Since cryptocurrency markets are highly volatile, technical indicators provide valuable insights into potential buying and selling opportunities.
While no indicator guarantees profits, combining multiple indicators with proper risk management can significantly improve trading accuracy.
Introduction
The cryptocurrency market operates 24/7 and is known for rapid price fluctuations. News events, investor sentiment, institutional activity, and blockchain developments can all influence prices within minutes.
Instead of relying on emotions or guesswork, professional traders use technical indicators to interpret market behavior and identify higher-probability trading setups.
This guide explains the Best Technical Indicators for Crypto, how they work, their strengths, limitations, and how beginners can use them responsibly.
What Are Technical Indicators?
Technical indicators are mathematical calculations based on historical price, trading volume, and market data. They help traders evaluate trends, momentum, volatility, and possible reversal points.
Rather than predicting the future with certainty, indicators improve the probability of making informed trading decisions.
Key Points
- Technical indicators support data-driven trading.
- No single indicator is always accurate.
- Combining indicators often improves analysis.
- Risk management remains essential.
- Indicators work best alongside market context.
- Backtesting helps validate trading strategies.
- Continuous learning improves long-term results.
Visual Introduction
Imagine two traders.
Trader A
- Buys because of social media hype.
- Sells during panic.
- Makes emotional decisions.
Trader B
- Studies charts.
- Uses RSI and MACD.
- Confirms trends with Moving Averages.
- Controls risk with stop-loss orders.
The second trader bases decisions on structured analysis rather than emotion.
Features of Technical Indicators
- Trend identification
- Momentum analysis
- Volatility measurement
- Entry and exit signals
- Risk assessment
- Market confirmation
- Multi-timeframe analysis
- Trading strategy development
- Performance evaluation
- Decision support
Benefits
Using technical indicators can help traders:
- Identify stronger trade opportunities
- Reduce emotional trading
- Improve market timing
- Detect trend reversals
- Understand market momentum
- Manage trading risk
- Build consistent strategies
- Increase analytical confidence
- Support disciplined decision-making
Quick Insights Table
| Indicator | Primary Purpose |
|---|---|
| RSI | Overbought & Oversold Conditions |
| MACD | Trend & Momentum |
| Moving Average | Trend Direction |
| Bollinger Bands | Market Volatility |
| Fibonacci Retracement | Support & Resistance |
| Volume Indicator | Trading Strength |
| Stochastic Oscillator | Momentum Analysis |
| Ichimoku Cloud | Trend Confirmation |
| ATR | Volatility Measurement |
| VWAP | Average Trading Price |
Step-by-Step Guide
Step 1
Choose a cryptocurrency trading platform with advanced charting tools.
Step 2
Select your preferred timeframe based on your trading style.
Step 3
Apply one or more technical indicators to the chart.
Step 4
Analyze price action alongside indicator signals.
Step 5
Look for confirmation from multiple indicators.
Step 6
Set entry, stop-loss, and profit targets before entering a trade.
Step 7
Review your trades regularly and refine your strategy over time.
Deep Explanation
1. Relative Strength Index (RSI)
RSI measures the speed and magnitude of recent price movements.
Common interpretation:
- Above 70: Potentially overbought
- Below 30: Potentially oversold
RSI is widely used to identify possible reversal zones.
2. Moving Average (MA)
Moving Averages smooth price fluctuations and help identify overall market direction.
Popular types:
- Simple Moving Average (SMA)
- Exponential Moving Average (EMA)
Traders often watch crossovers between short-term and long-term averages for trend signals.
3. MACD (Moving Average Convergence Divergence)
MACD compares two moving averages to evaluate momentum and trend strength.
Key components:
- MACD Line
- Signal Line
- Histogram
Crossovers can indicate potential bullish or bearish momentum shifts.
4. Bollinger Bands
Bollinger Bands consist of:
- Upper Band
- Middle Moving Average
- Lower Band
They help visualize market volatility and identify periods when prices move unusually far from the average.
5. Fibonacci Retracement
Fibonacci levels are commonly used to estimate potential support and resistance zones during market pullbacks.
Many traders monitor levels such as 38.2%, 50%, and 61.8% as areas where price reactions may occur.
6. Volume Indicator
Trading volume helps confirm whether price movements are supported by strong market participation.
Increasing volume during a breakout may indicate stronger conviction behind the move.
7. Stochastic Oscillator
This momentum indicator compares the closing price to the recent trading range and can help identify potential overbought or oversold conditions.
8. Ichimoku Cloud
The Ichimoku Cloud combines multiple indicators into one system to provide insights into trend direction, support, resistance, and momentum.
9. Average True Range (ATR)
ATR measures market volatility and is often used to determine stop-loss placement rather than trend direction.
10. Volume Weighted Average Price (VWAP)
VWAP reflects the average trading price weighted by volume and is commonly used by institutional traders to assess price efficiency during the trading session.
Small Case Study
A beginner crypto trader relied solely on social media recommendations and frequently entered trades without a plan. After learning to use RSI, Moving Averages, and MACD together, the trader developed a more disciplined approach, reducing impulsive decisions and improving consistency over time.
Real Example / Case Study
During periods of increased Bitcoin volatility, many professional traders combine trend-following indicators with momentum and volume analysis. Rather than acting on a single signal, they wait for multiple confirmations before entering a trade. This approach helps filter false signals and supports more informed decision-making.
Latest Trends in Technical Analysis (2026)
- AI-assisted chart analysis
- Automated trading systems
- Multi-indicator dashboards
- Predictive analytics
- On-chain technical analysis
- Machine learning integration
- Advanced volatility models
- Institutional trading algorithms
- Real-time market alerts
- Cross-market correlation analysis
Risks
Technical indicators have limitations.
Potential risks include:
- False signals
- Lagging data
- Unexpected market news
- High volatility
- Over-analysis
- Indicator overload
- Emotional decision-making
- Poor risk management
Responsible Trading
Responsible traders should:
- Combine technical analysis with market research.
- Use stop-loss orders.
- Diversify investments.
- Avoid risking more than they can afford to lose.
- Maintain a trading journal.
- Continue learning and improving.
Common Mistakes
- Using too many indicators simultaneously
- Ignoring market trends
- Trading without a plan
- Chasing quick profits
- Overtrading
- Ignoring risk management
- Depending on a single indicator
- Skipping backtesting
- Letting emotions control decisions
Pro Tips
- Master one indicator before adding another.
- Use multiple confirmations before entering trades.
- Focus on high-quality setups instead of frequent trades.
- Review historical chart patterns.
- Keep trading strategies simple and consistent.
- Adapt your approach as market conditions change.
Expert Quote
“Technical indicators are tools for probability—not certainty. Successful traders combine analysis with discipline and risk management.”
FAQ Section
Which technical indicator is best for crypto trading?
There is no single best indicator. Many traders combine RSI, MACD, Moving Averages, and Volume analysis for stronger confirmation.
Can beginners use technical indicators?
Yes. Beginners can start with simple indicators such as RSI and Moving Averages while gradually learning more advanced tools.
Do technical indicators guarantee profits?
No. Indicators improve analysis but cannot eliminate market risk or predict future prices with certainty.
Why should multiple indicators be combined?
Using complementary indicators can help confirm trends and reduce the likelihood of acting on false signals.
Is technical analysis enough?
Technical analysis is valuable, but combining it with fundamental research, market news, and sound risk management often leads to better decision-making.
Future Outlook
As artificial intelligence, blockchain analytics, and algorithmic trading continue to evolve, technical analysis is becoming more sophisticated. Future trading platforms are expected to integrate predictive analytics, automated pattern recognition, and real-time decision support, helping traders analyze markets more efficiently while still requiring human judgment and responsible risk management.
Conclusion
The Best Technical Indicators for Crypto provide valuable insights into market trends, momentum, volatility, and potential trading opportunities. While no indicator guarantees success, using a structured approach that combines multiple indicators with disciplined risk management can improve decision-making and trading consistency. Continuous learning, practice, and responsible investing remain essential for long-term success in cryptocurrency markets.
Why Choose Acointrix?
At Acointrix, we simplify cryptocurrency education with expert guides, market insights, blockchain resources, technical analysis tutorials, and practical investment strategies designed for both beginners and experienced traders.
Whether you’re learning chart analysis, exploring blockchain technology, or improving your trading skills, Acointrix provides reliable educational content to support informed crypto decisions.
Join Acointrix today and build your cryptocurrency knowledge with confidence.